
Visier Inc. - Hackathon
Role
Copy Writer
UX Designer
Timeline
January 2023 - April 2023
Tools
Figma
The Problem Space
We participated in a 24-hour hackathon where we were tasked with developing a digital solution to improve data analysis for Visier's clients. Working with a cross-functional team of web development, data science, and other UX designers. Our challenge for this hackathon was to solve Visier’s clients problem, new users found it hard trying to navigate the sheer volume of resources available for data analytics. With an overwhelming amount of data sets, charts, graphs, and metrics, the platform can be confusing and intimidating at first glance.
How Might We
We were then given Visier’s How Might We statement to help guide us on how to solve their problem.
“How might we make data analytics less overwhelming for new users to enhance their understanding of the Visier Platform?”
Brand Guidelines
To start off this hackathon, our team of UX designers did a quick investigation of their website, we used similar font styles and colours to make our product look like a solution they would’ve have come up themselves.
Branding Requirements:
Header font must be in Cera
Body font must be in Graphik
Must use brand colours for project
#FFFFFF
#4FA1A7
#20293A
Two fonts styles found on their website
Graphik (Body)
Cera (Header)
Title: 48 px
Body:16 px
Button 18 px (Large CTA) 16 px (Medium) 14 px (Small)
Subtitle
The quick brown fox
The quick brown fox
The quick brown fox
The quick brown fox
The quick brown fox (To Highlight Certain Text)
The quick brown fox
The quick brown fox
The quick brown fox
The quick brown fox
The quick brown fox
The quick brown fox
The quick brown fox
Graphik (Body Text Uses Regular)
Cera (Used for Buttons and Header Medium and Bold)
Action Plan
At the onset of our project, we faced a daunting challenge with the time we had. To make the project more manageable, we broke it down into smaller steps that we could accomplish. Before handing the project off to web development we needed to complete certain tasks.
I devised a schedule to keep ourselves on track and help delegate the tasks among us and play to our strengths.

Secondary Research
With the help of our data science teammates, we conducted secondary research to understand who Visier’s clients are and to help create a persona. By reviewing research articles, product reviews and other online sources we’ve identified the demographic and documented how they felt using Visier’s platform.
Demographics
We found the average age range for workers in the HR industry to be around 35 -54.
PWC reports 77% of HR leaders implementing data analytics into their decision making.
70% Female
30% Male
77%
23%
Findings
Using data analytics frees up HR departments from routine tasks and allows them to focus on strategic initiatives
Utilizing data analytics makes it easier to train new hires and increase company performance
Companies that use data analytics see an increase in employee retention compared to companies that don’t
Persona
Through our secondary research, we used the information we’ve gathered to build a proto persona to get an understanding of who Visier’s target audience is. With a persona we could understand who would be using this product, what their needs were and what their limitations were with this software. Taking all of this, it helped us define what kind of solution we should build to help Visier’s clients successfully navigate their software.
Empathetic Emma
Age: 35 years old
Occupation: HR Manager
Location: Vancouver, BC
Status: Single
Since the pandemic, I’ve been putting fires out left and right...just want to have a tool that helps me make the best informed decisions for the company

Taskflow
We then created a taskflow to help guide us in our designs, this helped us make informed decisions about the layout and how it would function as a product. While we were making the taskflow we were constantly asking how this taskflow would answer the problem of how could new users navigate better with the amount of data they had. Having a taskflow, something we can clearly visualize helped us keep that idea in our mind.

Ideation
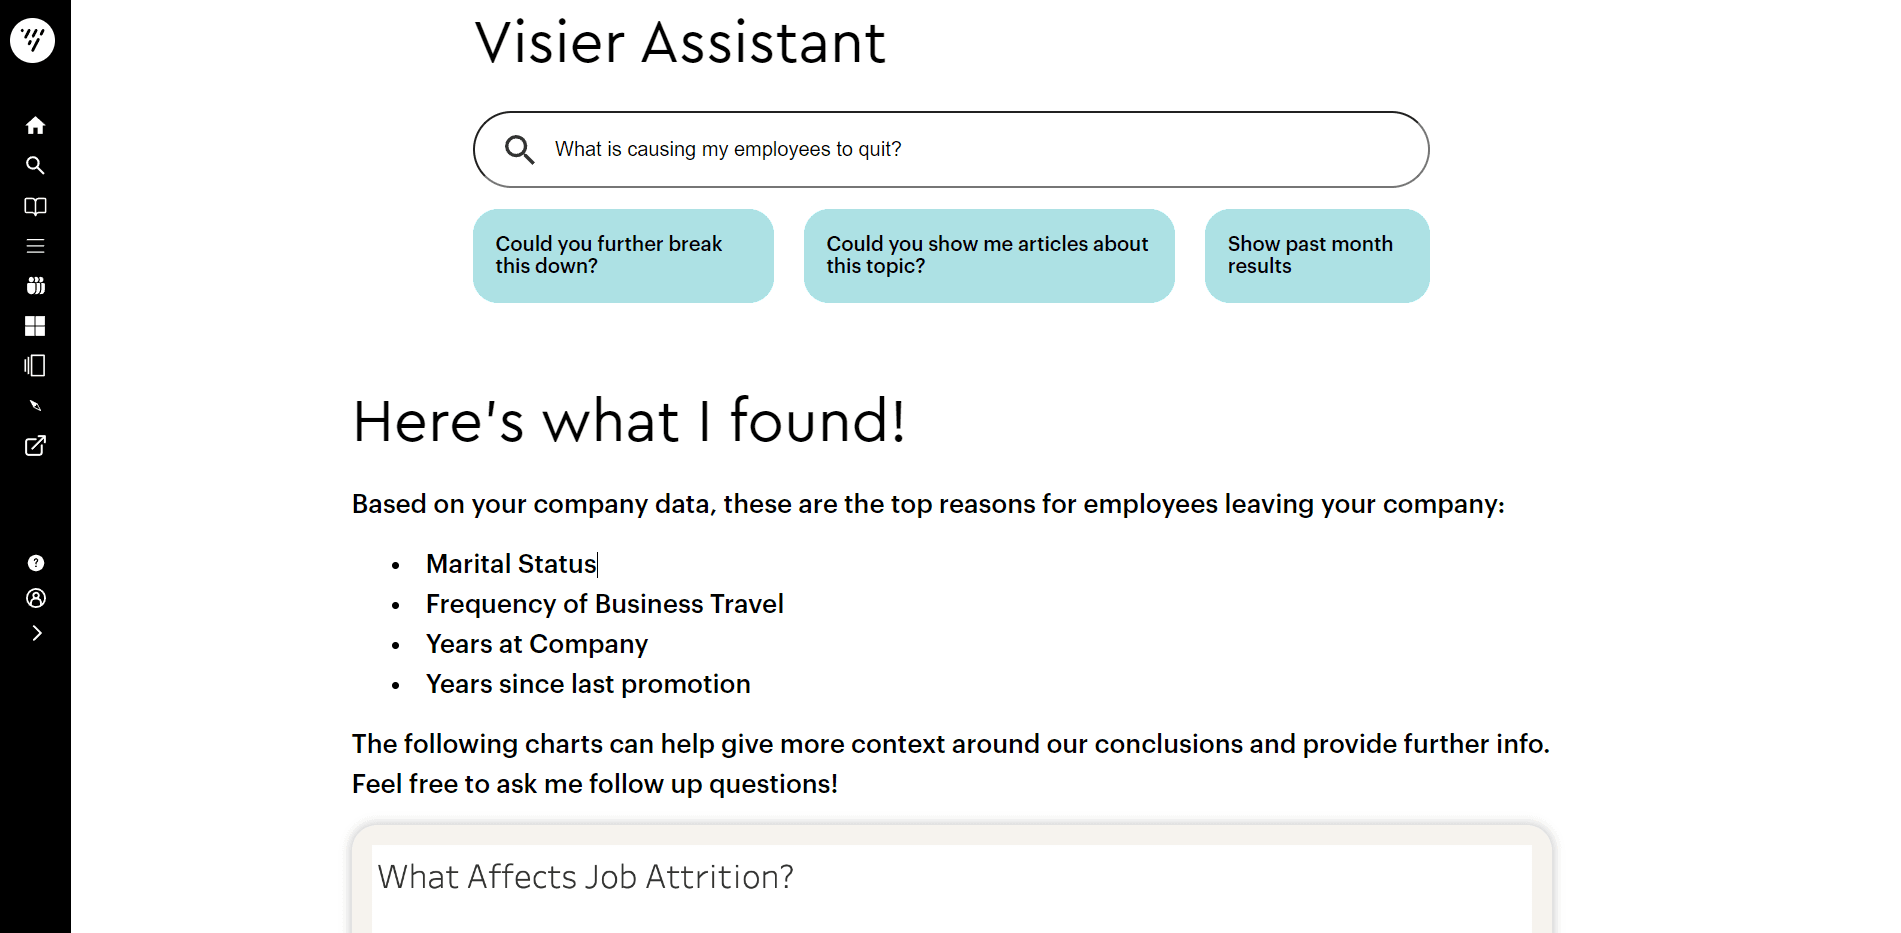
We put ourselves in Empathetic Emma's shoes and brainstormed solutions to solve the problem space. As a team, we generated multiple ideas and ultimately chose an AI feature that would assist the user in analyzing their data. After choosing the feature, we created low-fidelity screens to visualize how it would look and feel for the user.


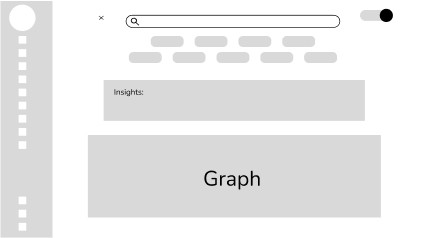
After completing the low-fidelity design, our UX team came together to review and refine the design features. Through collaboration, we decided on the final design that best suited the user's needs

Key Learnings
I was happy with the outcome of our project and the team that I was with. Everyone came from a unique background and lent their perspective to the project. We all complemented each other’s strengths and weaknesses which helped a lot with dividing responsibilities. There were times when our team experienced some bumps in the road, such as focusing on a detail for too long causing us to lose time. These were some of the lessons I wanted to include if I could do this a second time.
Sticking to the action plan better
Appoint a leader to help us keep on track better
Setting better lines of communication so we can get in touch with one another
Digital Solutions
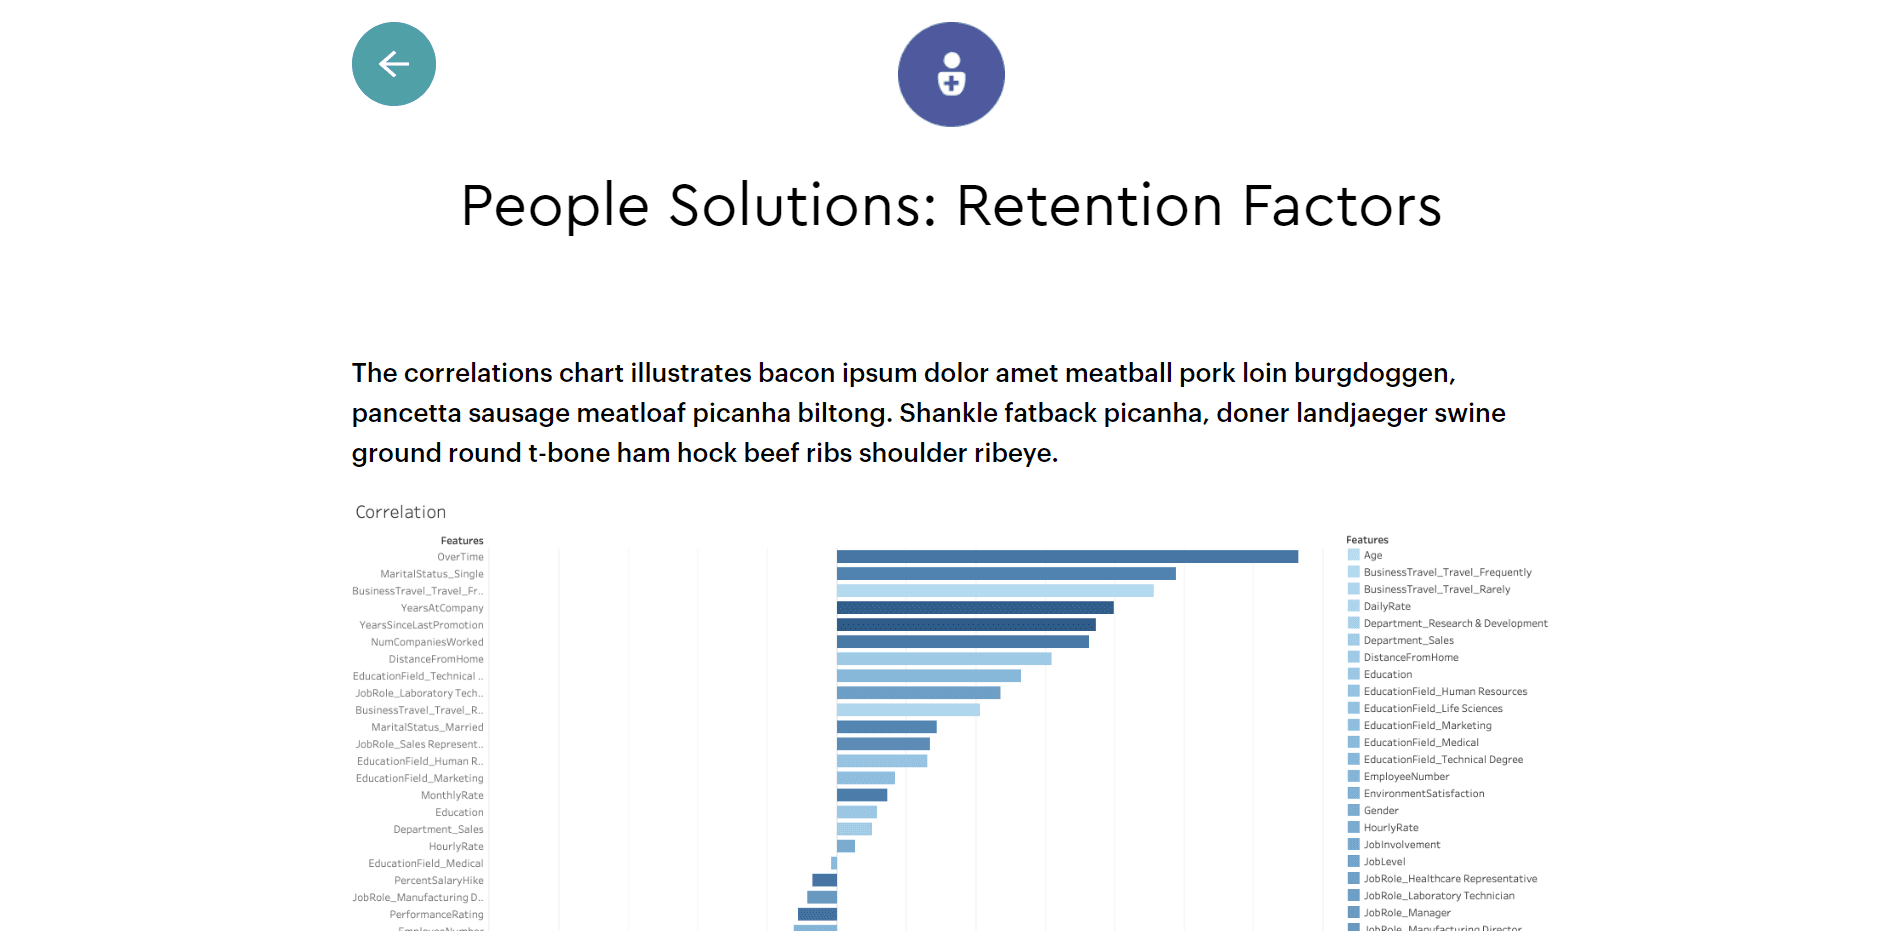
Once completing the high-fidelity design of our product, we handed it off to our web development team to create the final version. Through close collaboration between the UX and development teams, we were able to ensure that the final product aligned with our design vision and met the user's needs

Next Project
Vitacore -
Work Experience
Built a comprehensive design system, establishing guidelines and components to ensure consistency across all products and platforms.
